Planning & Decision Making in Business
We never know the future, and in a way for our decision making we have to deal with the uncertainty of the future. One way to deal with this uncertainty is by looking at the pay off matrix.
The concept of pay off matrix is nothing new, we actually use it atleast when we do our financial planning or retirement planning. Individual Financial planning is one case where we do look at different eventualities where the financial planner uses a monte-carlo simulation to look at how a portfolio may perform over the long run under uncertain markets. Simply put the Monte-carlo simulation is creating around 1000 futures and then picking the best and the worst future to display.
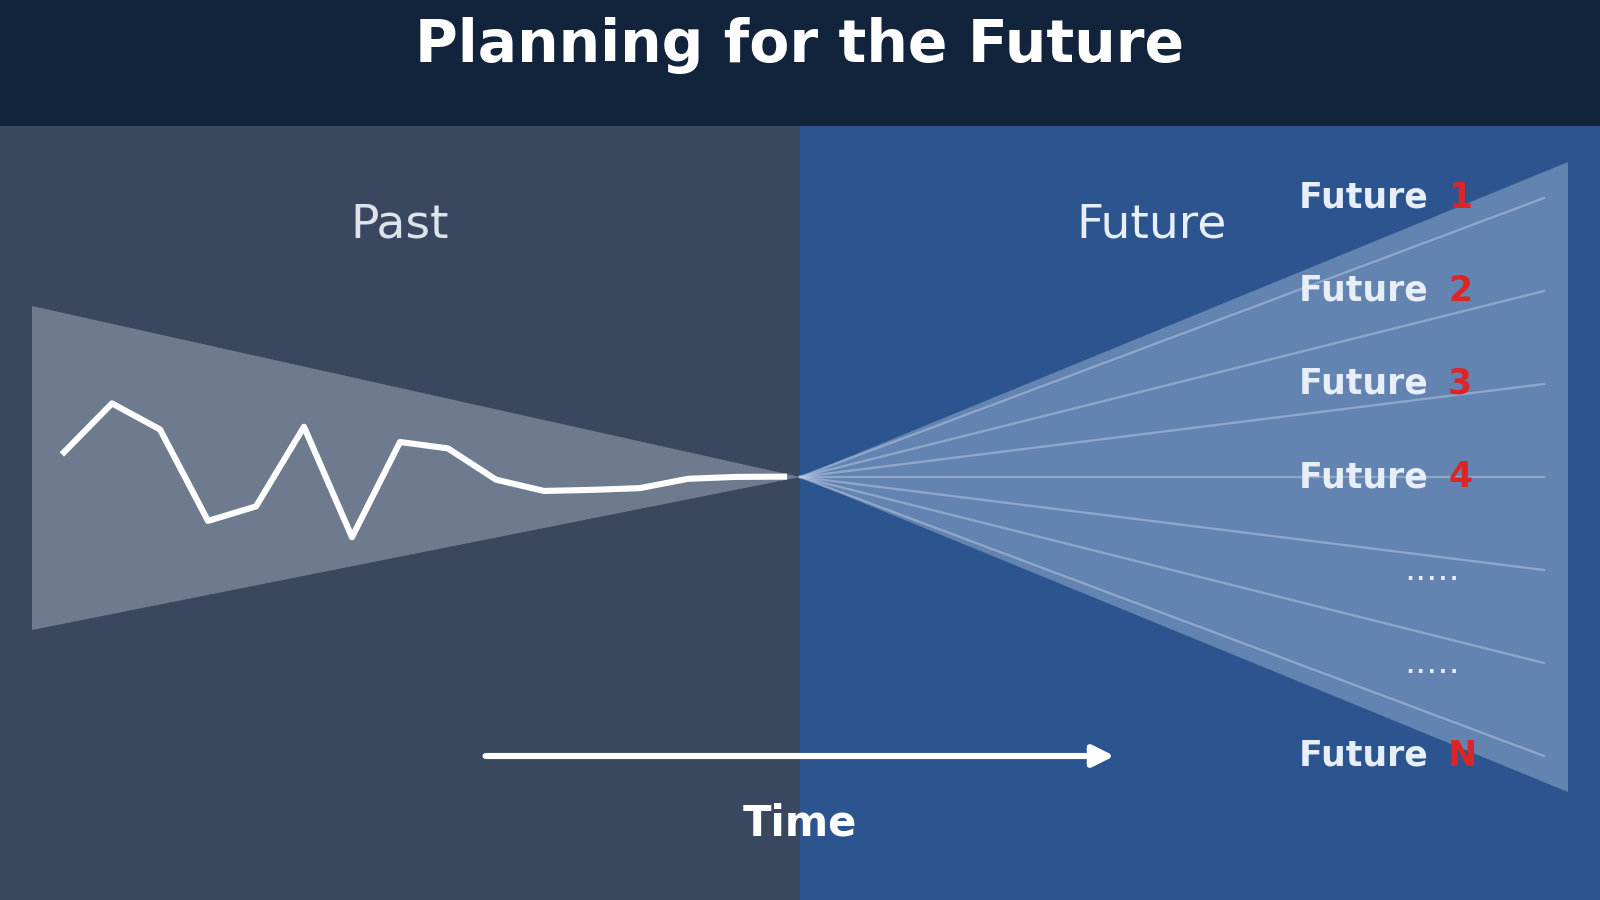
While a similar monte-carlo simulation is not possible in every situation, we definitely can create 1000 or more futures to evaluate how our decisions will play out.
Business decision makers may find it helpful if they could understand the implications of their decisions under several 1000 future states and understand the impact of their decisions. Let us look at a few such decisions.
A retail chain would like to evaluate two to three pricing and promotion plans that will be in effect for the next quarter. They would like to understand how the profit would be impacted based on the future described by # of customers who walk in to the store, the percentage who use store credit cards, the percentage who use other credit cards, amount of mail in rebates exercised etc.
Sales Compensation plans would need to be tested with three different territory structures that are being evaluated. The cost of sales compensation as a percentage of revenue would need to be evaluated against a future that would be described by sales turnover, quota achievements, demand for the product etc.
In both the above scenarios the future is described by more than one variable some of which may be correlated, but each of them have their own range, resulting in a future state that could be described as the combination of these variables.
Let me explain with a more concrete illustration of the above two scenarios:
For the retail scenario, we know that the number of customers who walk into the store are on the average 30 per day in the past year, but we have seen this varying between 25 to 38 in the past ten years. Similarly we know that store credit card usage is a function of the number of people who signed up in the past six months, but this function has a parameter that varies within a certain range. Similarly we also know the average proportion of other credit cards differentiating them solely by the cost per transaction of each credit card.
For the sales compensation scenario, we know the sales achievement against quota lies between a certain percentage for each sales rep based on historical performance. However if the quota increases then this percentage
By using simple stochastic models we could vary the future description automatically within that range with an option of varying each variable with a particular statistical distribution to make sure that the resulting data has the same randomness that could be seen in real life. This is the same idea as the Monte Carlo distribution used by Financial planners.
Originally published on LinkedIn as part of the Cloud Economics series.
Ready to Transform Your Business?
Let our expert team help you implement cutting-edge solutions that drive real results.