Data Simulation for Understanding Costs
Data is very important especially when designing software. We make several assumptions on the type of data the software will handle. When the data violates these assumptions not only can the software visibly fail, in other cases unexpected situations could arise which may be more severe. Yet creating data sets to adequately test software is usually the last thing on everyone’s mind.
With the cloud making the cost of infrastructure more transparent it will not be long when IT will be tasked not just to create applications that meet the business needs but also are transparent enough to monitor the cost per transaction. With transparency there will also be an added requirement to design applications that have low transactional costs.
In such situations data becomes all the more important not just in the amount of data but how the data is distributed to test the functional requirements but also the temporal distribution. Let me explain with an example. For example if we are building an e-commerce application of some kind that sells a digital product that costs $x to make or buy. This digital product would have to be stored and then retrieved and fulfilled during the order transactions. If more customers order within a given time period then more computing power and bandwidth is required to service these customers and if less customers order within a given time period less computing power and bandwidth will be required.
If we assume that the application is built on the cloud then it is assumed that the application architect has leveraged the elastic nature of the cloud to automatically scale computing capacity based on the number of customer requests in real time. If we assume that the operating margin is less than a dollar per transaction that is fulfilled, saving a few cents on the transactional costs can make a difference. It is therefore necessary to understand how the costs of the application changes as the time distribution of orders changes.
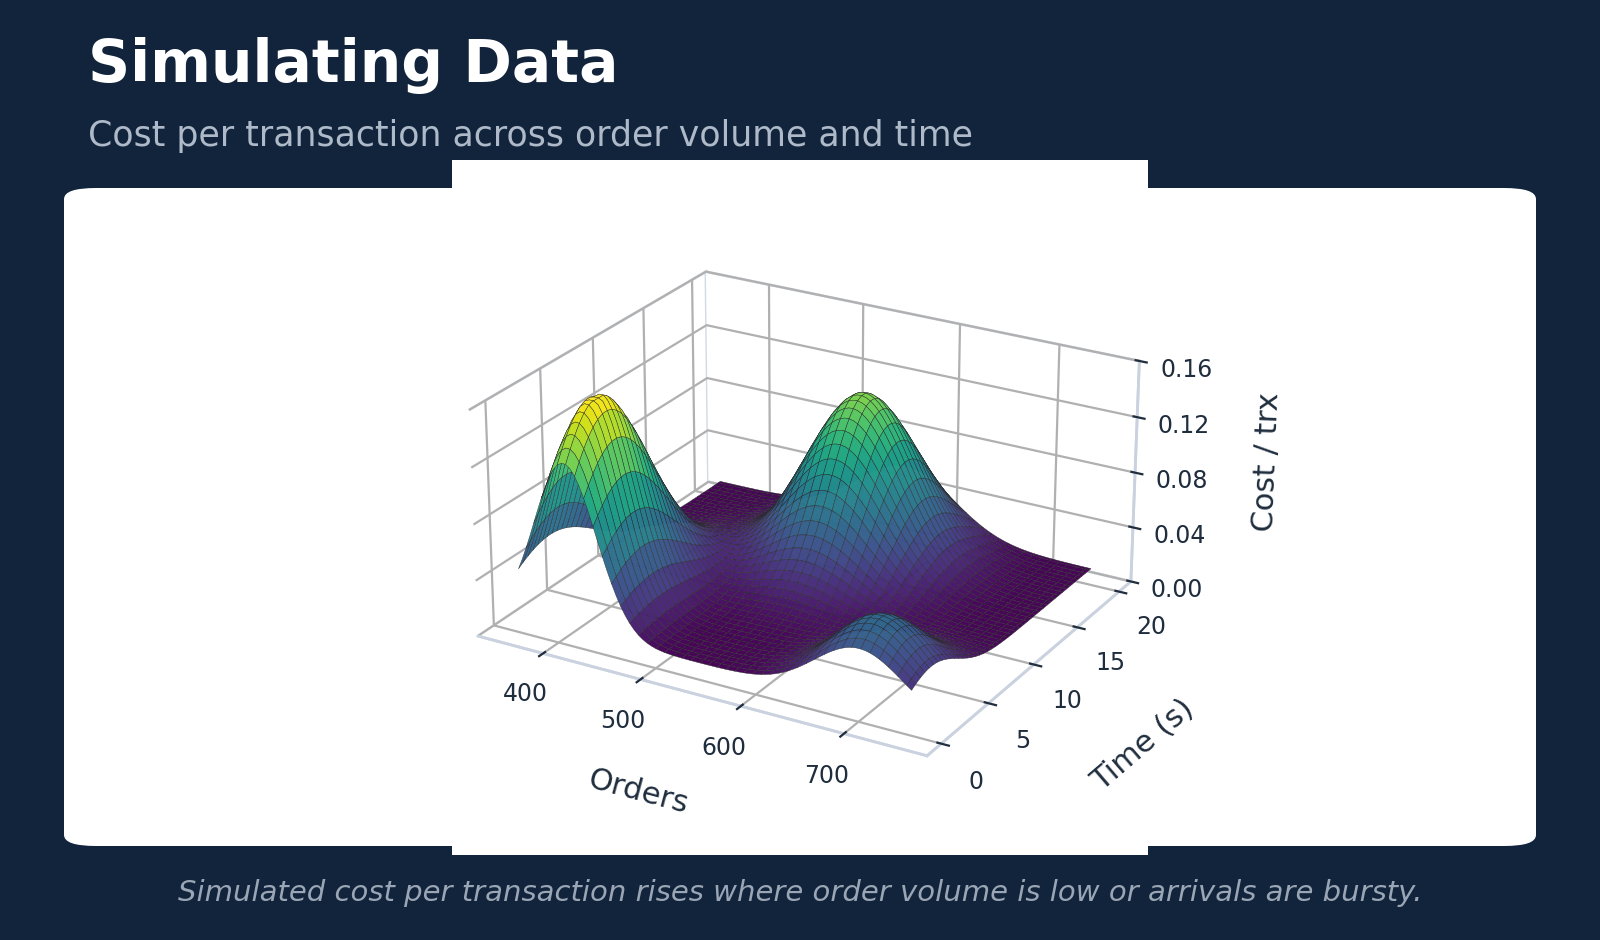
The graph above shows such an example where by simulating orders that hit the e-commerce application at different rates and how the costs differ with the volume of transactions as well as the rate of transactions. In other words not only do we have to simulate Order Data with different attributes like number of order lines but also has to be simulated across time.
The graph in the picture above shows how a simulated test data that varies across time can help populate the transactional costs against three dimensions, Cost / transaction, Time and Order volume.
Originally published on LinkedIn as part of the Cloud Economics series.
Ready to Transform Your Business?
Let our expert team help you implement cutting-edge solutions that drive real results.